# ABSTRACT
This study presents a comprehensive analysis of new energy electric vehicles (NEEVs) in China, employing a range of statistical methods and advanced algorithms. Using tools such as MATLAB, SPSS, and Excel, the research systematically addresses several critical questions regarding the development, impact, and future trajectory of NEEVs.
- Development of NEEVs in China: The study investigates the rapid growth of NEEVs in China, highlighting the influence of technological advancements and supportive government policies. An upward trend in vehicle ownership and market size is revealed, attributed to factors such as government subsidies, carbon emissions, and advancements in battery technology.
- Predictive Modeling: Predictive models, including multiple regression, ARIMA time series, and random forest algorithms, are employed to forecast the development of NEEVs over the next decade. The models indicate robust growth in sales and market penetration, driven by reduced costs and technological improvements.
- Market Dynamics: The research delves into the specific factors affecting the NEEV market in China, identifying key contributors such as patent applications, subsidies, and battery capacities. Regression analysis shows a positive relationship between these factors and the growth of NEEV ownership and market size.
- Impact on Traditional Energy Vehicles: The study assesses the impact of NEEVs on the global traditional energy vehicle industry, indicating a market transition favoring electric vehicles. This shift is driven by technological advancements, economic considerations, and environmental benefits associated with electric vehicles.
- Government and International Policies: The analysis extends to the effects of international policies on the development of NEEVs in China. Policies from countries like Germany, Japan, and the United States are examined, revealing their influence on China's NEEV market dynamics.
- Ecological Benefits: The study evaluates the ecological benefits of NEEVs, particularly in urban areas. It highlights significant reductions in carbon emissions when conventional vehicles are replaced with electric ones, underscoring the environmental advantages of NEEV adoption.
In conclusion, the paper provides a detailed evaluation of the NEEV market in China, offering valuable insights into its development, market dynamics, and future prospects. The findings underscore the importance of NEEVs in fostering environmental sustainability and economic growth.
Keywords: New Energy Electric Vehicles, Statistical Analysis, ARIMA, GA-BP Neural Network, Random Forest, Market Trends, Environmental Sustainability.
*Content*
*ABSTRACT* *1*
*Content* 2
*1.* *Introduction* 3
1.2 Problem background 3
1.3 Restatement of the Problem 3
1.4 Our work 4
*2.* *Assumptions and Justifications.* 6
*3.* ****Notation****s 6
*4.* *Data Desceiption* 7
4.1Data Collection 7
4.2 Data Cleaning 7
*5.Models and solutions* 8
5.1 Analyzing the main factors affecting the development of new energy electric vehicles in China 8
5.2 Predicting the future development of new energy electric vehicles in China in the next 10 years. 12
5.3 Collect data and establish a mathematical model to analyze the impact of new energy electric vehicles on the global traditional energy vehicle industry. 19
5.4 Some countries have formulated a series of policies targeted to resist the development of new energy electric vehicles in China. Establish a mathematical model to analyze the effects of these policies on the development of new energy electric vehicles in China. 23
5.6 Based on the conclusion of question 5, write an open letter to the citizens to publicize the benefits of new energy electric vehicles and the contributions of the electric vehicle industry in various countries around the world. 25
*Appendi**x* 27
\1. Introduction
1.1 *Problem background*
New energy vehicles refer to vehicles with advanced technical principles, new
technologies and new structures, which use unconventional vehicle fuel as their power source (unconventional automotive fuels refer to fuels other than gasoline and diesel) and integrate advanced technologies in vehicle power control and drive. New energy vehicles include four major types: hybrid electric vehicles, pure electric vehicles, fuel cell electric vehicles, and other new energy vehicles. As a type of new energy vehicle, new energy electric vehicles have achieved rapid development in recent years due to their properties of low pollution, low energy consumption, and ability to regulate peak electricity consumption. New energy electric vehicles, including electric buses and family electric cars with less than 7 seats, have been popular with consumers and governments around the world.
Since 2011, the Chinese government has actively promoted the development of new energy electric vehicles and formulated a series of preferential policies. The new energy electric vehicle industry has achieved tremendous development, gradually becoming another Chinese symbol after the “China High Speed Railway”.
1.2 *Restatement of the Problem*
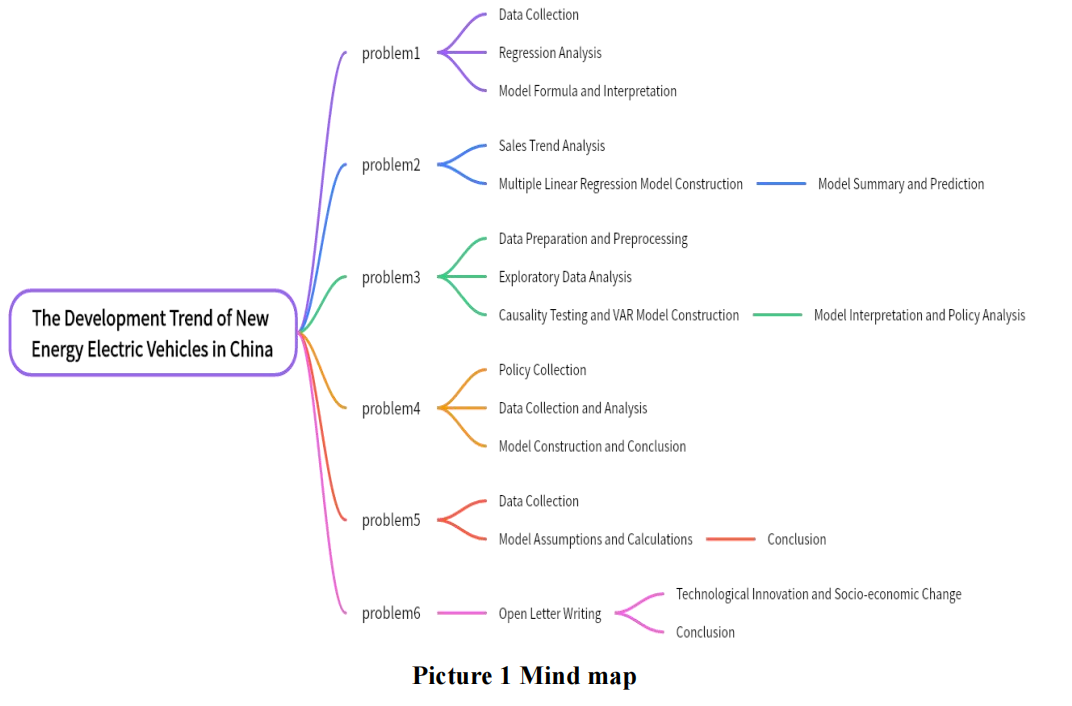
*problem* *1*
Analyze the main factors that affect the development of new energy electric vehicles in China, establish a mathematical model, and describe the impact of these factors on the development of new energy electric vehicles in China.
*problem* *2*
Collect industry development data on China’s new energy electric vehicles, establish a mathematical model to describe and predict the development of China’s new energy electric vehicles in the next 10 years.
*problem* *3*
Collect data and establish a mathematical model to analyze the impact of new energy electric vehicles on the global traditional energy vehicle industry.
*problem* *4*
Some countries have formulated a series of policies targeted to resist the development of new energy electric vehicles in China. Establish a mathematical model to analyze the effects of these policies on the development of new energy electric vehicles in China.2
*problem* *5*
Analyze the impact of the electrification of new energy electric vehicles (including electric buses) in cities on the ecological environment. Assuming that there is an urban population of 1 million, provide the calculation results of the model.
*problem* *6*
Based on the conclusion of question 5, write an open letter to the citizens to publicize the benefits of new energy electric vehicles and the contributions of the electric vehicle industry in various countries around the world.
1.3 *Our work*
1.1.1 *problem 1*
In analyzing China's new energy electric vehicles, we identified key factors like vehicle ownership and market size as dependent variables and included patent applications, subsidies, carbon emissions, battery capacities, vehicle price, and market penetration as independent variables. Our regression analysis showed an upward trend in vehicle ownership, suggesting a positive development in the sector. We addressed variable collinearity and established a robust model, highlighting the significant relationship between vehicle ownership, yearly changes, patent applications, and subsidy amounts.
1.1.2 *Problem 2*
Our study predicts a bright future for China's new energy vehicles, with sales trends showing considerable growth since 2013. Using a multiple linear regression model based on 19 independent variables, we forecasted the sector's growth for the next decade. The model exhibited an excellent fit, accurately mirroring the actual sales trends and projecting a continued rise in new energy vehicle sales.
1.1.3 *Problem 3*
Our research involved extensive data preparation and exploratory analysis to understand the impact of electric vehicles on the traditional energy vehicle industry. By employing time series, scatter plots, and correlation matrices, we established a VAR model to analyze the dynamic relationship between electric and traditional vehicle sales. The results indicated a significant influence of electric vehicle growth on the traditional vehicle market, informing policy implications and future industry trends.
1.1.4 *Problem 4*
This section assessed how international policies like Germany and Japan's opposition, the US Inflation Reduction Act, and the EU's investigation into Chinese electric vehicles affected China's market. Our analysis, based on export data and policy impacts in 2022 and 2023, revealed that these policies have somewhat hindered the growth of China's new energy vehicle exports.
1.1.5 *Problem 5*
Our study evaluated the ecological benefits of electrifying vehicles in urban areas. By comparing carbon emissions from traditional and electric vehicles, we concluded that a complete switch to electric vehicles could drastically reduce carbon emissions in a city of one million people, emphasizing the environmental advantages of electric vehicle adoption.
1.1.6 *Problem 6*
In an open letter to citizens, we highlighted the significant role of new energy electric vehicles in achieving a sustainable future. The letter underlined the environmental and technological benefits of electric vehicles, noting advancements in battery technology and smart systems. We encouraged public recognition of these benefits and the positive future outlook for the electric vehicle industry.
\1. Assumptions and Justifications**.**
A****ssumption 1: It is assumed that the data in each form is real and valid, and the sampling error is small. Only when the model is built on real data can reliable prediction results be obtained.
A****ssumption 2: It is assumed that the influence of other factors such as Consumer Acceptance is not considered. The model selects some factors that have a greater impact on vehicle ownership, vehicle market size and etc. as independent variables. Only by ignoring the influence of other factors can be reasonable prediction equation be obtained.
A****ssumption 3: It is assumed that the data obtained from the search has a certain degree of credibility and rationality. And the data is relatively complete.
\2. Notations
Table 1 Symbol Description
| *Symbol* | *Explanation* |
|---|---|
| *β* | the coefficient of x |
| *X**Y* | self variantimplicit variant |
\3. Data Desceiption
*4.1Data Collection*
Due to the fact that the mathematical modeling problem in this study is related to the development of new energy vehicles, in order to collect datasets related to the development of new energy vehicles, we searched many databases. The data in these databases are all related to new energy vehicles, and due to the different types of data provided by different databases, we integrated the data on an annual basis into a table. Below are the sources of the data and the meanings of variables.
*Table 2 Dataset source*

*4.2 Data Cleaning*
*4.2.1 Data missing value processing*
Due to the different departments and cycles of data recording, the amount of data in different data sets is not the same. In order to make the data sets of each variable available, the missing values in the data sets should be dealt with accordingly. In this paper, the regression interpolation method based on the serial trend is used to deal with the missing values of the data.
*4.2.2 Data Standardization processing*
Since each variable has different units and orders of magnitude, we standardize each data in order to facilitate the construction of our multiple regression model. In this paper, z-scores are used to process the data. It can be expressed by the following equation:
*z=(x-μ)/*σ (1)
*4.2.3 Factor correlation analysis chart*
According to the following correlation coefficient heatmap, it can be seen that when New energy vehicle ownership (10000 vehicles) and New Energy Vehicle Market Size (RMB bill) are used as dependent variables, their values are related to Year, Number of patient applications for new energy vehicles (items), Amount of subsidiaries for new energy vehicles (RMB bill), Total carbon emissions (miles of tons) Lithium iron phosphate power battery installed capacity/GWh, installed capacity of term battery/GWh, and weighted average price of new energy vehicles ($10000) are all related. And the correlation coefficients are relatively large (greater than 0.8 and mostly 0.95-1)
Therefore, the quantities we collected all have strong correlation, and they can all be used as independent variables to predict the sales or development of new energy vehicles.
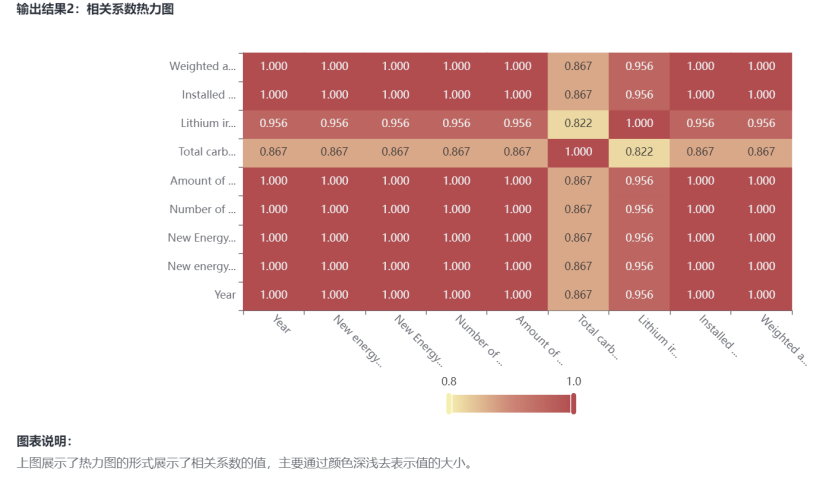
*Picture2 Correlation coefficient heat map*
5.Models and solutions
*5.1 Analyzing the main factors affecting the development of new energy electric vehicles in China*
*(1)Data collection*
We organize the collected data and set Year as an irrelevant variable, but changes in Year will affect the subsequent changes, so we keep Year. then we set New energy vehicle ownership (10,000 vehicles) and New Energy Vehicle Market Size (RMB billion) as dependent variables because our group believes that changes in these two variables can reflect changes in the development of new energy electric vehicles in China. Then we set Number of patent applications for new energy vehicles (items), Amount of subsidies for new energy vehicles (RMB billion), Total carbon emissions ( millions of tons), Lithium iron phosphate power battery installed capacity/GWh, Installed capacity of ternary battery/GWh, Weighted average price of new energy vehicles ($10,000), New energy vehicle market penetration (%) are set as independent variables, considering that they are the main factors affecting the change of the dependent variable.
Therefore, we design the statistical graph as shown below.
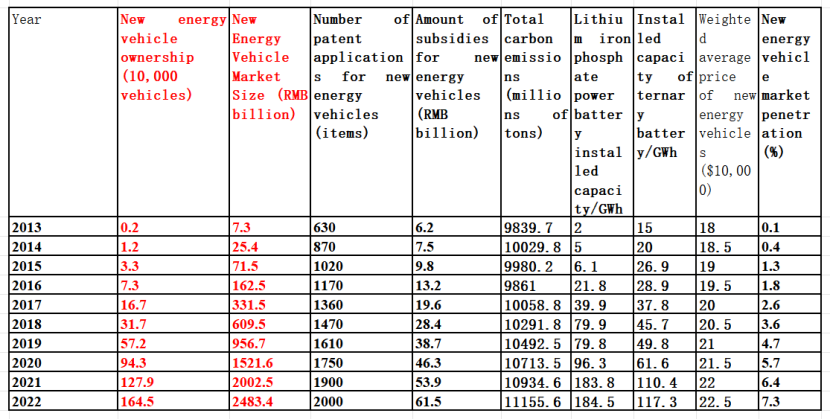
*Picture3 Statistical data on factors affecting the development of new energy vehicles*
(2)*New energy vehicle ownership (10,000 vehicles) multiple regression curve*
According to the change of New energy vehicle ownership (10,000 vehicles) and its first-order difference curve over the years, it can be seen that New energy vehicle ownership (10,000 vehicles) shows an upward trend, so the factors in the multivariate regression curve of New energy vehicle ownership (10,000 vehicles) should generally show an upward trend after weighting. Therefore, the factors in the multiple regression curve of New energy vehicle ownership (10,000 vehicles) should be in an upward trend after weighting in general. And we can also know that the curve of New energy vehicle ownership (10,000 vehicles) is accelerating in general.
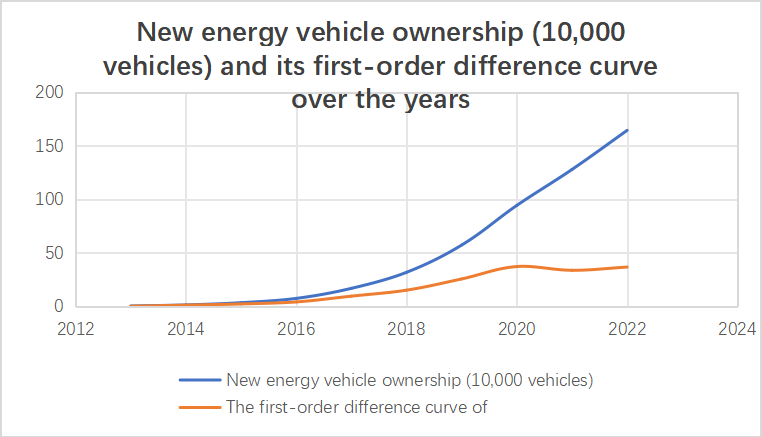
*Picture4 Vehicle ownership and its first-order difference curve vary with year*
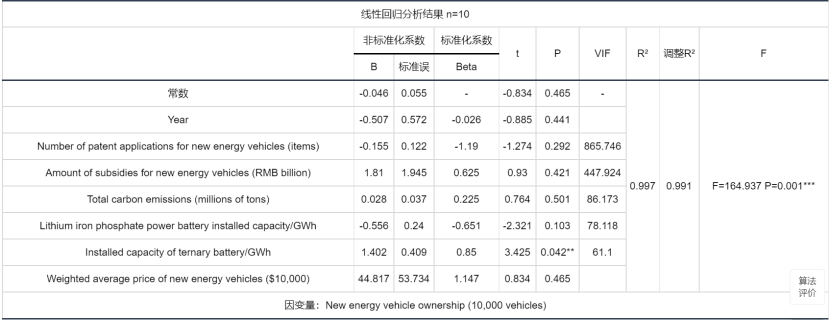
The analysis of the results of the F-test shows that the P-value of significance is 0.001 * * *, which is significant at the level and rejects the null hypothesis of a regression coefficient of 0. Therefore, the model basically meets the requirements.
For the collinearity performance of variables, the VIF values of Year, Number of patent applications for new energy vehicles (items), Amount of subsidiaries for new energy vehicles (RMB bill), Total carbon emissions (miles of tons), Lithium iron phase power battery installed capacity/GWh, Installed capacity of term battery/GWh, Weighted average price of new energy vehicles ($10000) are greater than 10, There is a collinear relationship, so it is easy to remove the collinear independent variables or perform ridge regression or stepwise regression.
The formula of the model is as follows: y=-0.046-0.507 * Year -0.155 * Number of patient applications for new energy vehicles (items)+1.81 * Amount of subsidiaries for new energy vehicles (RMB bill)+0.028 * Total carbon emissions (miles of tons) -0.556 * Lithium iron phase power battery installed capacity/GWh+1.402 * Installed capacity of term battery/GWh+44.817 * Weighted average price of new energy vehicles ($10000).
This also confirms that the fit is very good.
Table3 Table of results of linear regression analysis
The following figure shows the independent variables X: {Year, Number of patient applications for new energy vehicles (items), Amount of subsidiaries for new energy vehicles (RMB bill), Total carbon emissions (miles of tons), Lithium iron phase power battery installed capacity/GWh, Installed capacity of term battery/GWh, Weighted average price of new energy vehicles ($10000)}; The relationship between the dependent variable Y:
We order:
y=New energy vehicle ownership (10,000 vehicles)
x1=Year
x2=Number of patent applications for new energy vehicles (items)
x3=Amount of subsidies for new energy vehicles (RMB billion)
x4=Total carbon emissions (millions of tons)
x5=Lithium iron phosphate power battery installed capacity/GWh
x6=Installed capacity of ternary battery/GWh
x7=Weighted average price of new energy vehicles ($10,000)
According to the statistics listed above,we could get this function:
y=-0.046-0.507x1-0.155x2+1.81x3+0.028x4-0.556x5+1.402x6+44.817x7(2)
Table4 multivariate regression coefficient value
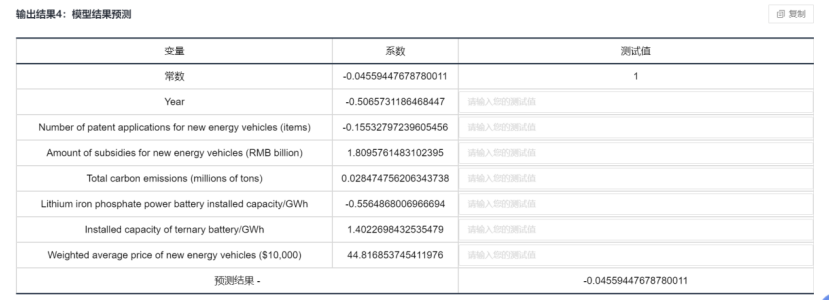
The following graph shows the raw data plot, model fitted values, and model predicted values for this model.
According to the graph, the fit is very good.
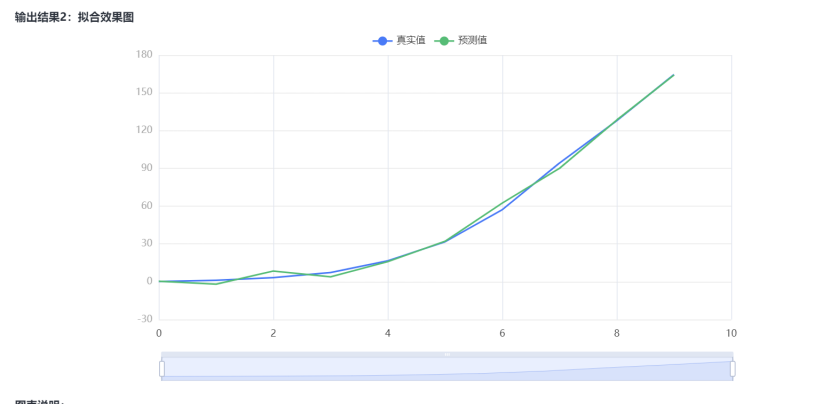
Picture5 Comparison of model fit and true value
Based on the resultant fit we know that the predicted value of New energy vehicle ownership (10,000 vehicles) is very close to the true value and the fit is successful.
(3)*New Energy Vehicle Market Size (RMB billion) multiple regression curve*
*In the same way as above, we can obtain a set of equations:*
New Energy Vehicle Market Size (RMB billion)=-0.569-6.291(Year)-1.893*(Number of patent applications for new energy vehicles (items))+28.455*(Amount of subsidies for new energy vehicles (RMB billion))+0.344(Total carbon emissions (millions of tons))-5.866*(Lithium iron phosphate power battery installed capacity/GWh)+16.201*(Installed capacity of ternary battery/GWh)+559.405*(Weighted average price of new energy vehicles ($10,000))
(4)*Analyzing and summarizing the first question*
In general, government subsidies, total carbon emissions, installed capacity of ternary batteries, and the weighted average price of new energy vehicles have a positive impact on the market size, while the number of patent applications and the installed capacity of lithium iron phosphate power batteries have a negative impact.
However, from my perspective, an increase in the number of patent applications may signify the growing applicability of patents to new energy vehicles. Additionally, as the development of lithium iron phosphate power batteries matures, it is likely to have a positive impact on the market size. We recognize that during the initial stages of technological development, significant investments are required, and any short-term negative impacts may be inconsequential. Following our group research, a consensus has emerged that these factors will likely contribute positively to the new energy vehicle market in the future.
Therefore, it is conceivable that a higher number of patent applications could reflect increased technological relevance to new energy vehicles, and the mature development of lithium iron phosphate power batteries may eventually contribute positively to the market size. As our group collectively believes, these factors are expected to benefit the new energy vehicle market substantially in the future.
*5.2 Predicting the future development of new energy electric vehicles in China in the next 10 years.*
(1)*Preliminary trend of increase/decrease based on sales graphs*
The sales of new energy vehicles year by year according to the year - sales plotted as the following curve, from which we can see that the sales of new energy vehicles and the year between the year does have a rising trend, and we can see that the sales of new energy vehicles in the initial emergence of the trend of low-frequency slow growth in about 2013, and in 2020 after the trend of high rate of growth, the analysis of the world's new energy science and technology and the Chinese government's new energy vehicle policy support and other factors, to be discussed in the follow-up.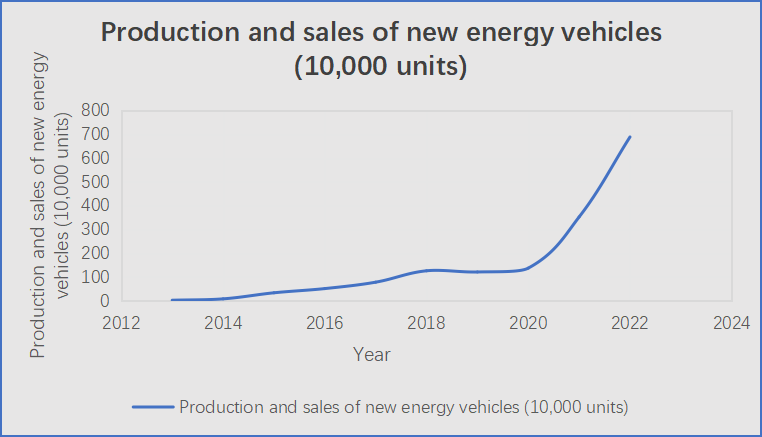
*Picture6 Year vs. graph Production and sales of new energy vehicles (10,000 units)*
After the sales of new energy vehicles are processed by the first-order difference, the obtained first-order difference-year graph shows an exponential growth trend, which generally shows a relatively smooth first and a rapid growth trend until the beginning of 2020. Overall it is still in the form of growth.
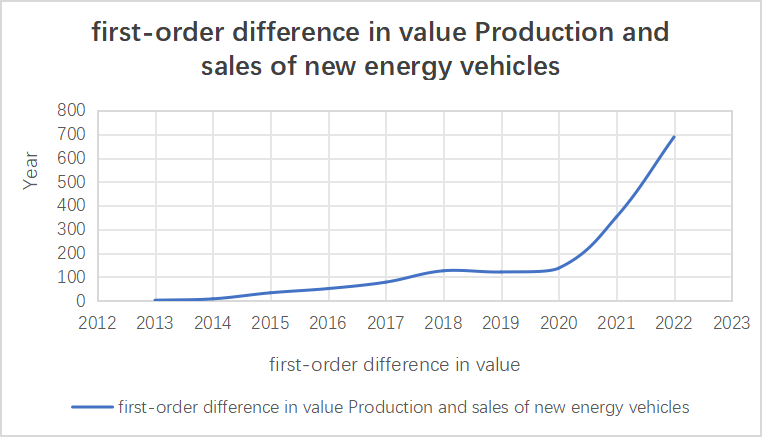
*Picture**7 first-order difference in value Production and sales of new energy vehicles*
(2) *Modeling based on multiple regression linear curves*
(3) Combining examples and research, we can find that the change of annual sales of new energy vehicles is related to Year、New energy vehicle ownership (10,000 vehicles)、New Energy Vehicle Market Size (RMB billion)、New energy vehicle market penetration (%)、New Energy Vehicle YoY Growth Rate (%)、Number of new energy vehicle enterprises (number)、Number of patent applications for new energy vehicles (items)、Scale of new energy vehicle industry chain (home)、Number of charging piles for new energy vehicles (10,000)、Coverage of new energy vehicle charging infrastructure (%)、Amount of subsidies for new energy vehicles (RMB billion)、Market penetration of conventional fuel vehicles (%)、Total carbon emissions in the Yangtze River Delta region (million tons)、Production and sales of conventional vehicles (10,000 units)、Conventional Vehicles YoY Growth Rate (%)、Lithium iron phosphate power battery installed capacity/GWh、Installed capacity of ternary battery/GWh、Total carbon emissions (millions of tons)、Weighted average price of new energy vehicles ($10,000)and other variable factors are closely related.
Therefore, we will model the relationship between Production and sales of new energy vehicles (10,000 units) and the other 19 independent variables based on the collected dataset.And the model's conclusions are used to predict the development of new energy electric vehicles in China over the next decade.
⚫ Build multiple linear models
We order:
x1=Year
x2=New energy vehicle ownership (10,000 vehicles)
x3=New Energy Vehicle Market Size (RMB billion)
x4=New energy vehicle market penetration (%)
x5=New Energy Vehicle YoY Growth Rate (%)
x6=Number of new energy vehicle enterprises (number)
x7=Number of patent applications for new energy vehicles (items)
x8=Scale of new energy vehicle industry chain (home)
x9=Number of charging piles for new energy vehicles (10,000)
x10=Coverage of new energy vehicle charging infrastructure (%)
x11=Amount of subsidies for new energy vehicles (RMB billion)
x12=Market penetration of conventional fuel vehicles (%)
x13=Total carbon emissions in the Yangtze River Delta region (million tons)
x14=Production and sales of conventional vehicles (10,000 units)
x15=Conventional Vehicles YoY Growth Rate (%)
x16=Lithium iron phosphate power battery installed capacity/GWh
x17=Installed capacity of ternary battery/GWh
x18=Total carbon emissions (millions of tons)
x19=Weighted average price of new energy vehicles ($10,000)
y=β0+β1x1+β2x2+β3x3+β4x4+β5x5+β6x6+β7x7+β8x8+β9x9+β10x10+β11x11+β12x12+β13x13+β14x14+β15x15+β16x16+β17x17+β18x18+β19x19 (3)
Using the python code for the multiple regression algorithm (Appendix 1), we can get the value of this multiple regression equation as:
y=-175.361921+0.786334x1+4.674333x2+0.133171x3+1.340155x4+0.203066x5+5.114536x6-1.460884x7+0.602279x8+2.367206x9-7.039104x10+7.524213x11-1.340155x12-0.623688x13+0.488335x14-6.786688x15-2.279974x16+5.143792x17-0.075757x18+0.393167x19 (4)
Table****5 Model Summary
| Model | R | R square | Adjust R square |
|---|---|---|---|
| 0.930 | 0.865 | 0.980 |
According to the multiple regression model it is shown that the model R is 0.930, the square of R is 0.865 and the adjusted R square value is 0.980, which indicates a very good fit.
Hypothesis is raised in F-test: all coefficients are 0. From the ANOVA table (see appendix), it can be seen that the p value of the F test is <0.001, and the null hypothesis is rejected at the significance level of 0.05, and the test is passed.
We substituted formulas to calculate projected annual sales based on the values of the other nineteen formulas (the algorithm is attached in the Appendix), and then calculated a graph of year-annual sales - projected sales as follows.
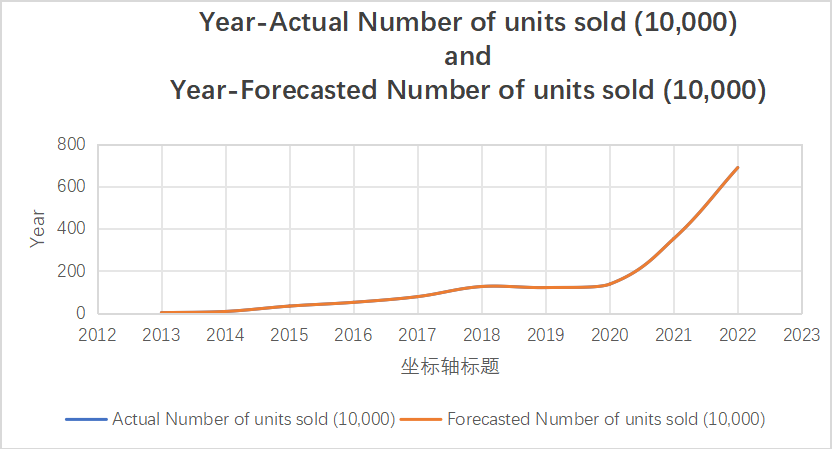
*picture8 imagery of year-annual sales - projected sales*
From the above figure, we can find that the number of expected annual sales and the actual number of annual sales is really too close, leading to the fact that we may wonder whether there is a second line drawn, so we do not put a different way of thinking, to make the number of expected annual sales - the actual number of annual sales of the x-y curve, we can clearly see that the slope of the image k = 1, and the intercept is only -0.0046, which is very small, so you can approximate that the predicted results are exactly the same as the actual results. The fit is valid.
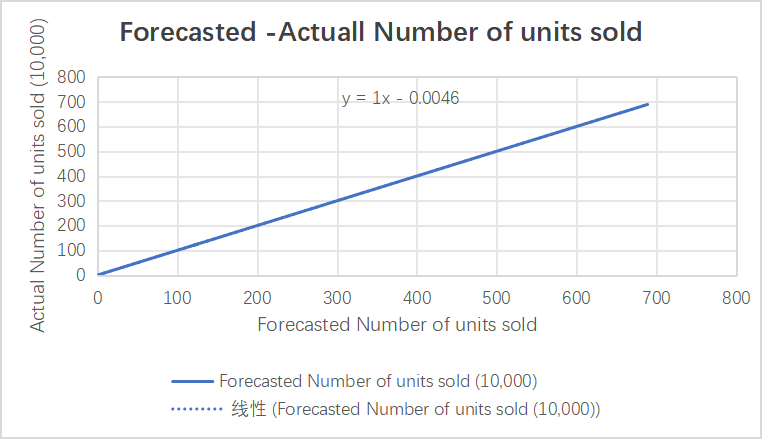
*Picture9 Forecasted - Actuall Number of units sold*
From the graph I gave and the formula new energy vehicle production and sales (10,000 units) = -175.361921 + 0.786334 × year + 4.674333 × new energy vehicle ownership (10,000 units) + 0.133171 × new energy vehicle market size (100 million yuan) + 1.340155 × new energy vehicle market penetration rate (%) + 0.203066 × new energy vehicle vehicle chain growth rate (%) +5.114536×number of new energy vehicle enterprises (home) +-1.460884×number of new energy vehicle patent applications (item) +0.602279×size of new energy vehicle industry chain (home) +2.367206×number of new energy vehicle charging piles (10,000 pcs) +-7.039104×coverage of new energy vehicle charging infrastructure ( %) + 7.524213 × amount of subsidies for new energy vehicles (RMB 100 million) + -1.340155 × market penetration rate of traditional fuel vehicles (%) + -0.623688 × total carbon emissions in the Yangtze River Delta region (millions of tons) + 0.488335 × production and sales volume of traditional vehicles (10,000 vehicles) + -6.786688 × chain growth rate of traditional vehicles (%) + - 2.279974×Lithium iron phosphate power battery installed volume/GWh+5.143792×Ternary battery installed volume/GWh+- can be known.
\1. New energy vehicle production and sales (10,000 units) and year, new energy vehicle ownership (10,000 units), new energy vehicle market size (RMB 100 million), new energy vehicle market penetration rate (%), new energy vehicle chain growth rate (%), number of new energy vehicle enterprises (home), new energy vehicle industry chain size (home) new energy vehicle industry chain size (home), number of new energy vehicle charging piles (10,000) The independent variables of new energy vehicle subsidy amount (RMB 100 million), installed capacity of ternary batteries/GWh, and weighted average price of new energy vehicles (RMB 10,000) are positively correlated.
\2. Negative correlation with total carbon emissions (million tons), chain growth rate of conventional vehicles (%), etc.
From the following change curves of the respective variables, it can be seen that the total sales volume of new energy vehicles (10,000 units) will grow exponentially in the next ten years.
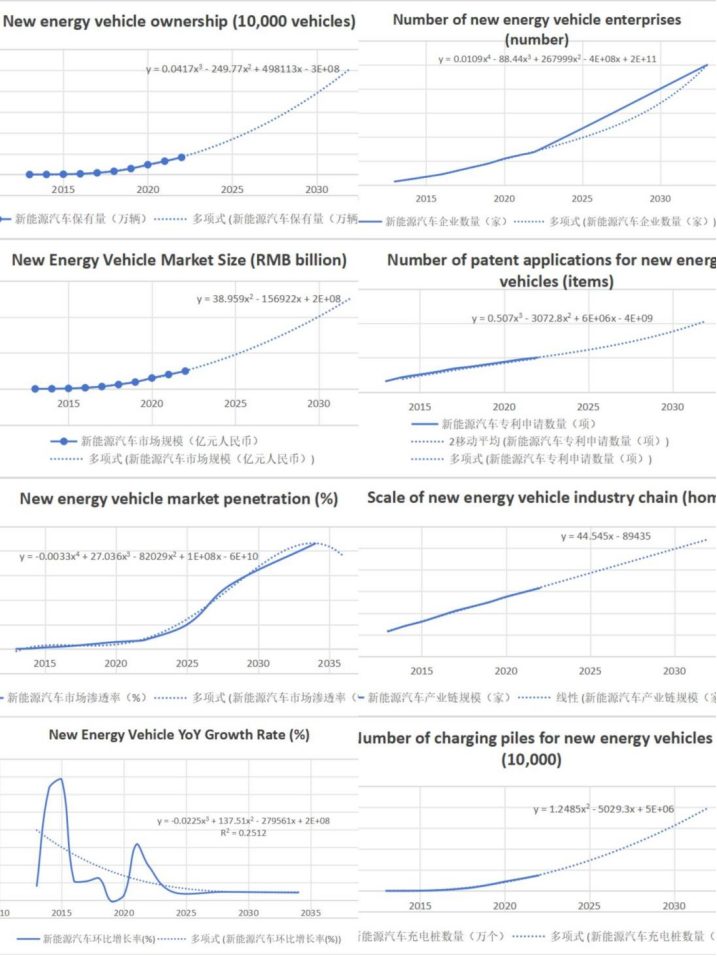
*Picture10 The variation curve of each variable over the year(1)*
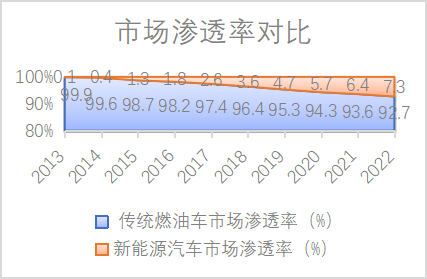
*Picture11 Comparison of Market Penetration Rates of Conventional and New Energy Vehicles*
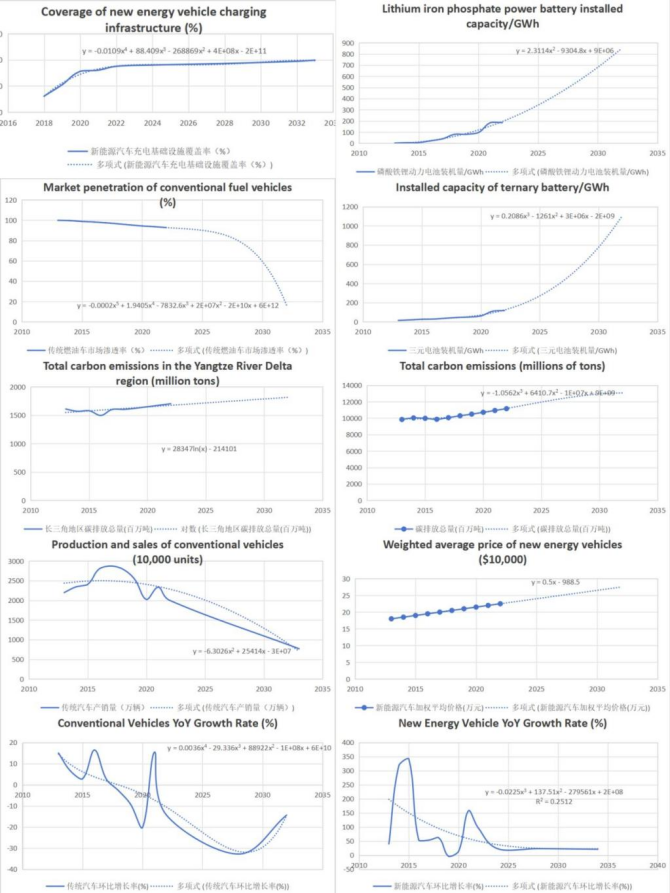
*Picture12 The variation curve of each variable over the year(2)*
In summary, I have the following views on the development of new energy vehicles in China in the next decade:
\1. In the next decade, the number of new energy vehicles (10000 units) will steadily increase, currently showing a cubic growth, and will continue to grow until reaching a certain order of magnitude and starting to grow steadily and slowly.
\2. The scale of the new energy vehicle market (in billions of RMB) will be greatly increased, gradually surpassing the sharp decline in the traditional vehicle market size with increasing derivatives
\3. The penetration rate (%) of the new energy vehicle market will gradually increase, ultimately reaching over 70%.
\4. The month on month growth rate (%) of new energy vehicles will first increase and then decrease. As the month on month growth is compared to the previous year's growth, the growth rate will not be particularly high in the future, but overall it still shows a growth trend.
\5. The number of new energy vehicle enterprises will increase. As new energy vehicles are an emerging market, manufacturers such as Tesla will make a lot of money, which will attract more manufacturers to enter new energy. At present, the most representative manufacturers are Huawei's Wenjie and Xiaomi Motors.
The number of patent applications for new energy vehicles will gradually increase, and then gradually decrease. Due to the current peak period of new energy vehicle development, it is normal for patents to spring up one after another. As the new energy industry gradually matures in the future, the number of patents will decrease.
\7. The scale of the new energy vehicle industry chain will gradually increase, consistent with the conclusion in 5
The number of new energy vehicle charging stations (10000) will be significantly increased to adapt to the increasing holdings of new energy vehicles and attract new customers.
\9. The coverage rate (%) of new energy vehicle charging infrastructure will be significantly increased, for the same reason.
The most important thing is that the sales of new energy vehicles will also steadily increase. In short, the development of new energy electric vehicles in China in the next 10 years will be very promising, and the future is bound to be limitless!
*5.3* *Collect data and establish a mathematical model to analyze the impact of new energy electric vehicles on the global traditional energy vehicle industry.*
# Data Preparation and Preprocessing:
Data Organization: Transform raw data into an analyzable format, ensuring correct data types for each variable (e.g., years as date format, sales volumes as numerical values).
Missing Values: Inspect the dataset for any missing entries. If present, choose to impute (using methods like mean of neighboring values, median, or regression prediction based on other variables) or to exclude missing records.
Outlier Analysis: Identify and scrutinize outliers to determine whether they result from input errors or natural fluctuations. Correct or exclude errors; retain natural fluctuations as they may represent real-world scenarios.
Normalization/Standardization: Apply normalization or standardization techniques (such as Z-score standardization) to adjust the scale of data, eliminating the influence of different variable magnitudes.
# Exploratory Data Analysis (EDA):
Time Series Analysis: Plot time series for each variable to observe trends and patterns over time, identifying any evident trends or seasonality.
Scatter Plot Analysis: Create scatter plots to explore relationships between variables, such as the relationship between electric vehicle sales and crude oil prices.
Correlation Matrix Visualization: Construct a correlation matrix and visualize it to discern linear relationships between variables, aiding in variable selection for the VAR model.
# Correlation Analysis:
Pearson Correlation Coefficient: Compute the Pearson correlation coefficient between electric vehicle sales, traditional vehicle sales, and crude oil prices to quantitatively describe their linear relationships.
Significance Testing: Perform tests to ascertain the statistical significance of the correlation coefficients, thus determining the reliability of the relationships between variables.
# Causality Testing:
Granger Causality Test: Conduct Granger causality tests to determine if one variable's historical values can significantly predict future values of another, thereby establishing a Granger cause.
Lag Selection: Choose the number of lags to use in Granger causality testing, typically selected based on information criteria such as AIC or BIC.
# VAR Model Construction:
Variable Selection: Based on EDA and correlation analysis outcomes, select appropriate variables for the VAR model.
Model Estimation: Estimate the VAR model's parameters using the ordinary least squares method.
Lag Structure Determination: Determine the optimal lag order for the VAR model using information criteria.
# Model Estimation and Testing:
Model Diagnostics: Conduct diagnostic tests, including tests for autocorrelation of residuals, heteroscedasticity, and model stability.
Predictive Accuracy: Assess the model's predictive accuracy, often by reserving a portion of data as a test set.
# Model Interpretation and Policy Analysis:
Impact Interpretation: Interpret the results of the VAR model, discussing how the growth in electric vehicle sales dynamically influences the sales of traditional energy vehicles.
Policy Impact Discussion: Explore how electric vehicle-related policies might affect the relationships between these variables and how policymakers can utilize these findings.
External Factors Consideration: Discuss potential external factors that may impact the markets for electric vehicles and traditional energy vehicles, and how these factors might be incorporated into future research.
# Translated Conclusions:
The data indicates that the market share of electric vehicles grew from 0.4% in 2013 to 18.6% in 2022, a substantial increase that correlates with a decline in traditional energy vehicle sales. Specifically, as electric vehicle sales have risen, traditional vehicle sales have demonstrated a downward trend. This suggests a shift in consumer preferences and the impact of reduced costs and technological advancements in electric vehicles, attracting more buyers.
The increase in the electric vehicle market share significantly correlates with a decrease in the average fuel consumption of traditional vehicles. This suggests that automobile manufacturers may be enhancing the fuel efficiency of traditional vehicles to compete with electric vehicles, or consumers may be increasingly opting for models with lower fuel consumption.
While the growth in electric vehicle market share has not directly impacted crude oil prices (the correlation is not significant), it does not preclude the potential for long-term effects on the energy market. As electric vehicle costs continue to decrease and policies further support, the demand for traditional fuel vehicles might decline, potentially affecting future crude oil demand and prices.
In conclusion, the emergence of electric vehicles is gradually impacting the global traditional energy vehicle industry. Specifically, with the continuing expansion of the electric vehicle market share, global sales of traditional vehicles have begun to be affected, as indicated by decreasing sales. Meanwhile, the traditional vehicle industry's technological adaptation is reflected in improved fuel efficiency and reduced consumption. However, so far, the rise in the electric vehicle market has not had a significant impact on crude oil prices, which may be due to the crude oil market being influenced by a variety of factors, including global economic activity levels, international political situations, and the development of alternative energy markets.
*5.4 Some countries have formulated a series of policies targeted to resist the* *development of new energy electric vehicles in China. Establish a mathematical model to* *analyze the effects of these policies on the development of new energy electric vehicles in China.*
*(1)Policy* *Collection*
In June 2022, Germany and Japan were strongly opposed to new energy sources.
On 16 August 2022 the Inflation Reduction Act (IRA) was signed into law, under which only electric vehicles assembled in North America are eligible for tax credits.
On 4 October 2023, the EU launched a countervailing investigation into China's new battery electric vehicles.
*(2)**Data collection*
In order to analyse these policies on the development of new energy electric vehicles in China, we collected the export volume of new energy vehicles from 2011 to 2023, As shown in the figure below
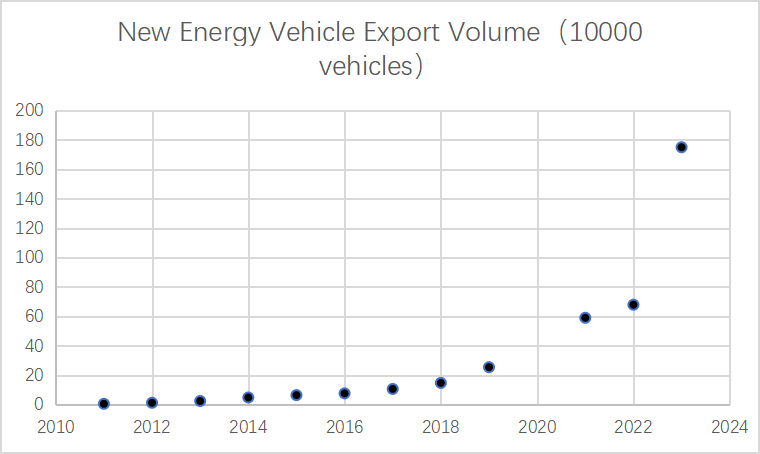
*Picture13 New Energy Vehicle Export Volume scatterplot*
The anomaly is removed due to the impact of the New Crown Epidemic, which resulted in a decrease rather than an increase in exports of new energy electric vehicles in 2020
As the above policies are concentrated in 2022 as well as 2023, we fitted a non-linear fit to the data as shown in the following figure, to specifically compare exports in 2022 and 2023.
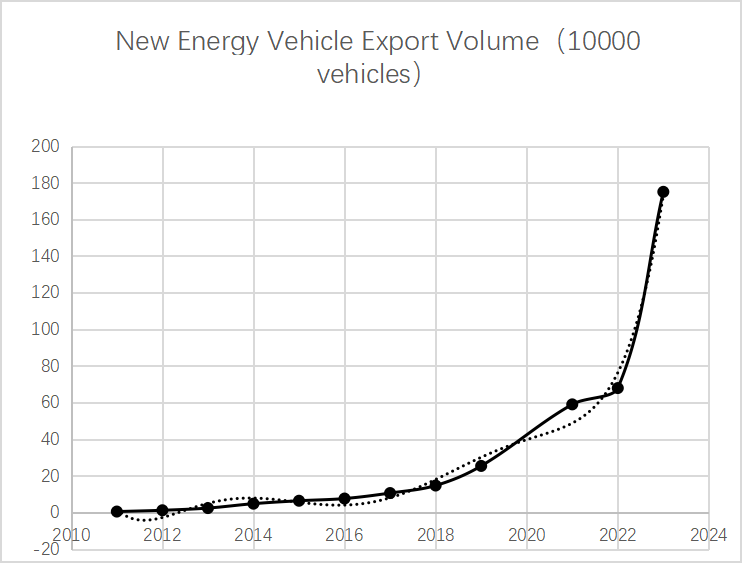
*Picture14 New Energy Vehicle Export Volume and Time curve*
Get the polynomial function:
y=-0.0049x6-59.72x5+301061x4 *(5)*
Comparing the estimates of new energy vehicle exports corresponding to the fitted curves with the actual data using the fitted curves, it can be seen that these policies have indeed inhibited the development of new energy electric vehicles in China.
*5**.5 Analyze the impact of the electrification of new energy electric vehicles (including* *electric buses) in cities on the ecological environment. Assuming that there is an urban* *population of 1 million, provide the calculation results of the model.*
*(**1) Data Collection*
The carbon emission factor for petrol is 2.951kg-CO2/kg, each liter of petrol weights approximately 750g, total combustion produces 2.194kg CO2, the average fuel consumption of a conventional car is 6.46L/ 100 kilometres, The resulting 100 km for conventional cars CO2 emissions: 14.17kg/km, average fuel consumption of conventional buses is 25L/100km, conventional buses 100km CO2 emissions: 54.85kg/km;
grid carbon intensity is 0.65kg/kWh, and the average electric vehicle power consumption is 15kWh/100km, resulting in 100km CO2 emissions from electric vehicles: 9.75kg/100km, electric buses on average Electricity consumption is 56.6kWh/100km, CO2 emission of 100km from electric bus: 36.79kg/km.
*(**2)* *model assumption*
The population of the city is 1 million, assuming that there are on average 3 people in a household, and each household has a car, i.e., there are 333,000 cars in the city; there are 70,000 buses in the city. The average journey of a car in a day is 300km, which gives the difference in CO2 emissions between new energy electric cars and traditional cars as 48.4 tons/vehicleper year, and the difference in CO2 emissions between new energy electric buses and traditional buses as 197.76 tons/vehicleper year, and the difference in the total annual CO2emissions between new energy electric vehicles and traditional vehicles as 2,996 tons, and China's average per capita carbon emissions as 6.8 tons. When all vehicles in the city are replaced with new energy vehicles, the city's per capita carbon emissions can be reduced by 2.996 tons, a whopping 44%!
*5.**6* *Based on the conclusion of question 5, write an open letter to the citizens to publicize the benefits of new energy electric vehicles and the contributions of the electric vehicle industry in various countries around the world.*
Dear Citizens,
In our journey towards a sustainable future, the emergence and expansion of new energy electric vehicles (EVs) stand as a testament to our collective commitment to environmental stewardship and technological innovation. These vehicles, characterized by their minimal environmental footprint, are pivotal in reducing urban pollution and enhancing air quality. Unlike their traditional counterparts, EVs convert energy with remarkable efficiency, offering a sustainable alternative that aligns with the global imperative to conserve resources.
In addition to their environmental benefits, electric vehicles are driving technological advancements across multiple sectors, including battery technology, smart connectivity, and autonomous driving systems. This evolution is not just a leap in vehicular technology but a catalyst for broader socio-economic changes. Economically, EVs present a cost-effective solution for consumers, promising lower long-term operating and maintenance expenses.
Globally, countries have been contributing significantly to this transformative movement. China, for instance, has solidified its position as a leader in the EV market, boasting record-breaking sales and a rapidly increasing market penetration. The Chinese government's robust policies under its dual carbon goals have been instrumental in catalyzing this growth, demonstrating a commitment to high-quality industry development. Concurrently, the United States has embarked on an ambitious plan to integrate EVs into its national fabric. With strategic investments in infrastructure and manufacturing, driven by comprehensive legislative support like the Bipartisan Infrastructure Law and the Inflation Reduction Act, the U.S. is poised to significantly influence the global EV landscape.
Similarly, the European Union's initiatives have been pivotal in driving EV adoption. By implementing stringent CO2 emission standards, the EU has not only promoted environmentally friendly vehicles but also spurred innovation in green technologies. The collaborative efforts of European nations in policy formulation and infrastructure development further underline a shared vision for a green and sustainable future.
As we embrace this era of electric vehicles, it is evident that our choices transcend beyond individual preferences to a collective responsibility towards a greener, more efficient, and sustainable world. The commitment and actions of countries like China, the United States, and the European Union reflect a global paradigm shift, one where the adoption of electric vehicles is a key component in our pursuit of environmental sustainability and economic resilience.
In closing, the journey towards a sustainable future is not a solitary endeavor but a collaborative effort that requires the participation and support of each one of us. As we continue to witness and contribute to this transformation, let us remember that each step towards embracing electric vehicles is a step towards a cleaner and more sustainable world.
Sincerely
2023-11-25
*Appendix*
Data
| Data | Data sources | ||||||||||||||||||
|---|---|---|---|---|---|---|---|---|---|---|---|---|---|---|---|---|---|---|---|
| Market share of new energy vehicles, etc. | NDANEV:http://www.ndanev.com/ | ||||||||||||||||||
| Market penetration of new energy vehicles and conventional vehicles | National Bureau of Statistics, Ministry of Industry and Information Technology, New Energy Vehicle Association | ||||||||||||||||||
| China's total annual carbon emissions | https://www.thepaper.cn/newsDetail_forward_19895247 | ||||||||||||||||||
| Number of new energy vehicle patents | China Patent Publication Announcement Network | ||||||||||||||||||
| Development of New Energy Vehicle Battery | China ICT | ||||||||||||||||||
| Infrastructure coverage and number of charging piles for new energy vehicles | Data Center for Resource and Environmental Sciences, Chinese Academy of Sciences | ||||||||||||||||||
| 年份 | 新能源汽车销量(万 / 辆) | 年份 | 市场占有率(%) | 年份 | 电池平均能量密度(Wh/kg) | ||||||||||||||
| ---- | ----------------------- | ---- | ---- | ---- | --------------- | ---- | ---- | ---- | ------------------------- | ||||||||||
| 2016 | 50.7 | 2016 | 1.8 | 2016 | 75 | ||||||||||||||
| 2017 | 77.7 | 2017 | 2.7 | 2017 | 95 | ||||||||||||||
| 2018 | 126.8 | 2018 | 4.5 | 2018 | 105 | ||||||||||||||
| 2019 | 120.6 | 2019 | 4.68 | 2019 | 140 | ||||||||||||||
| 2020 | 140.9 | 2020 | 5.4 | 2020 | 153 | ||||||||||||||
| 2021 | 352.9 | 2021 | 23.5 | 2021 | 215 | ||||||||||||||
| 2022 | 689.9 | 2022 | 25.6 | 2022 | 280 | ||||||||||||||
| 2023 | 945.9 | 2023 | 30.4 | 2023 | 300 | ||||||||||||||
| 年份 | 电机效率(%) | 年份 | 充电桩数量(万个) | ||||||||||||||||
| ---- | ------------- | ---- | ---- | ---- | ------------------ | ||||||||||||||
| 2016 | 80-88 | 84 | 2016 | 16.6 | |||||||||||||||
| 2017 | 85-90 | 87.5 | 2017 | 45 | |||||||||||||||
| 2018 | 88-92 | 90 | 2018 | 77.7 | |||||||||||||||
| 2019 | 90-95 | 93 | 2019 | 121.9 | |||||||||||||||
| 2020 | 91-96 | 93.5 | 2020 | 168.1 | |||||||||||||||
| 2021 | 92-97 | 94.5 | 2021 | 261.7 | |||||||||||||||
| 2022 | 93-98 | 95.5 | 2022 | 521 | |||||||||||||||
| 2023 | 94-98 | 96 | 2023 | 795.4 | |||||||||||||||
| 年份 | 补贴估计值(万) | ||||||||||||||||||
| ---- | ---------------- | ||||||||||||||||||
| 2016 | 5 | ||||||||||||||||||
| 2017 | 7 | ||||||||||||||||||
| 2018 | 6 | ||||||||||||||||||
| 2019 | 4 | ||||||||||||||||||
| 2020 | 3.5 | ||||||||||||||||||
| 2021 | 3 | ||||||||||||||||||
| 2022 | 2 | ||||||||||||||||||
| 2023 | 1.5 | ||||||||||||||||||
| 年份 | 产业协同率(%) | ||||||||||||||||||
| ---- | --------------- | ||||||||||||||||||
| 2016 | 35 | ||||||||||||||||||
| 2017 | 40 | ||||||||||||||||||
| 2018 | 45 | ||||||||||||||||||
| 2019 | 50 | ||||||||||||||||||
| 2020 | 55 | ||||||||||||||||||
| 2021 | 60 | ||||||||||||||||||
| 2022 | 65 | ||||||||||||||||||
| 2023 | 70 | ||||||||||||||||||
| 年份 | 中国新能源汽车产量(万辆) | ||||||||||||||||||
| ---- | -------------------------- | ||||||||||||||||||
| 2016 | 51.7 | ||||||||||||||||||
| 2017 | 79.4 | ||||||||||||||||||
| 2018 | 127.9 | ||||||||||||||||||
| 2019 | 124.9 | ||||||||||||||||||
| 2020 | 145.9 | ||||||||||||||||||
| 2021 | 367.8 | ||||||||||||||||||
| 2022 | 700.8 | ||||||||||||||||||
| 2023 | 1000 | ||||||||||||||||||
| 年份 | 新能源汽车产量增长率(%) | ||||||||||||||||||
| ---- | ------------------------- | ||||||||||||||||||
| 2016 | 53 | ||||||||||||||||||
| 2017 | 53.3 | ||||||||||||||||||
| 2018 | 79.5 | ||||||||||||||||||
| 2019 | 0.11 | ||||||||||||||||||
| 2020 | 7.5 | ||||||||||||||||||
| 2021 | 145.6 | ||||||||||||||||||
| 2022 | 96.9 | ||||||||||||||||||
| 2023 | 40 | ||||||||||||||||||
| 年份 | 中国燃油车产量(万辆) | ||||||||||||||||||
| ---- | ---------------------- | ||||||||||||||||||
| 2016 | 2819 | ||||||||||||||||||
| 2017 | 2942.5 | ||||||||||||||||||
| 2018 | 2781 | ||||||||||||||||||
| 2019 | 2456 | ||||||||||||||||||
| 2020 | 2531.1 | ||||||||||||||||||
| 2021 | 2458.8 | ||||||||||||||||||
| 2022 | 1508.1 | ||||||||||||||||||
| 2023 | 1955.7 | ||||||||||||||||||
| 年份 | 新能源汽车保有量(万辆) | 新能源汽车市场规模(亿元人民币) | 新能源汽车企业数量(家) | 新能源汽车专利申请数量(项) | 新能源汽车产业链规模(家) | 新能源汽车充电桩数量(万个) | 新能源汽车充电基础设施覆盖率(%) | 新能源汽车补贴金额(亿元人民币) | 传统燃油车市场渗透率(%) | 新能源汽车市场渗透率(%) | 长三角地区碳排放总量 (百万吨) | 新能源汽车产销量(万辆) | 新能源汽车环比增长率 (%) | 传统汽车产销量(万辆) | 传统汽车环比增长率 (%) | 磷酸铁锂动力电池装机量 / GWh | 三元电池装机量 / GWh | 碳排放总量 (百万吨) | 新能源汽车加权平均价格 (万元) |
| ---- | ------------------------ | -------------------------------- | ------------------------ | ---------------------------- | -------------------------- | ---------------------------- | --------------------------------- | -------------------------------- | ------------------------- | ------------------------- | ---------------------------- | ------------------------ | ----------------------- | ---------------------- | --------------------- | -------------------------- | ------------------ | ------------------ | ---------------------------- |
| 2013 | 0.2 | 7.3 | 30 | 630 | 230 | 0.3 | 0.5 | 6.2 | 99.9 | 0.1 | 1608.79 | 1.79 | 39.8 | 2198.3 | 15 | 2 | 15 | 9839.7 | 18 |
| 2014 | 1.2 | 25.4 | 50 | 870 | 280 | 0.6 | 1.7 | 7.5 | 99.6 | 0.4 | 1569.41 | 7.48 | 317.9 | 2341.2 | 6.5 | 5 | 20 | 10029.8 | 18.5 |
| 2015 | 3.3 | 71.5 | 70 | 1020 | 320 | 1.2 | 3.5 | 9.8 | 98.7 | 1.3 | 1578.45 | 33.01 | 341.4 | 2406.5 | 2.8 | 6.1 | 26.9 | 9980.2 | 19 |
| 2016 | 7.3 | 162.5 | 90 | 1170 | 370 | 3.5 | 8.7 | 13.2 | 98.2 | 1.8 | 1496.37 | 50.71 | 53.6 | 2801.5 | 16.4 | 21.8 | 28.9 | 9861 | 19.5 |
| 2017 | 16.7 | 331.5 | 120 | 1360 | 420 | 8.2 | 17.2 | 19.6 | 97.4 | 2.6 | 1602.22 | 77.68 | 53.3 | 2871.5 | 2.5 | 39.9 | 37.8 | 10058.8 | 20 |
| 2018 | 31.7 | 609.5 | 150 | 1470 | 460 | 15.6 | 30.5 | 28.4 | 96.4 | 3.6 | 1602.72 | 125.6 | 61.7 | 2791.7 | -2.8 | 79.9 | 45.7 | 10291.8 | 20.5 |
| 2019 | 57.2 | 956.7 | 180 | 1610 | 500 | 28.4 | 52.3 | 38.7 | 95.3 | 4.7 | 1623.18 | 120.6 | -4.0 | 2535.4 | -9.2 | 79.8 | 49.8 | 10492.5 | 21 |
| 2020 | 94.3 | 1521.6 | 220 | 1750 | 550 | 44.7 | 77.9 | 46.3 | 94.3 | 5.7 | 1649.15 | 136.8 | 13.4 | 2023.1 | -20.2 | 96.3 | 61.6 | 10713.5 | 21.5 |
| 2021 | 127.9 | 2002.5 | 250 | 1900 | 590 | 59.1 | 80.2 | 53.9 | 93.6 | 6.4 | 1675.53 | 352.1 | 157.6 | 2334.1 | 15.4 | 183.8 | 110.4 | 10934.6 | 22 |
| 2022 | 164.5 | 2483.4 | 280 | 2000 | 630 | 74.2 | 87.6 | 61.5 | 92.7 | 7.3 | 1702.35 | 688.7 | 95.6 | 1997.7 | -14.4 | 184.5 | 117.3 | 11155.6 | 22.5 |
| 年份 | 新能源汽车保有量(万辆) | 新能源汽车市场规模(亿元人民币) | 新能源汽车专利申请数量(项) | 新能源汽车补贴金额(亿元人民币) | 碳排放总量 (百万吨) | 磷酸铁锂动力电池装机量 / GWh | 三元电池装机量 / GWh | 新能源汽车加权平均价格 (万元) | 新能源汽车市场渗透率(%) | ||||||||||
| ---- | ------------------------ | -------------------------------- | ---------------------------- | -------------------------------- | ------------------ | -------------------------- | ------------------ | ---------------------------- | ------------------------- | ||||||||||
| 2013 | 0.2 | 7.3 | 630 | 6.2 | 9839.7 | 2 | 15 | 18 | 0.1 | ||||||||||
| 2014 | 1.2 | 25.4 | 870 | 7.5 | 10029.8 | 5 | 20 | 18.5 | 0.4 | ||||||||||
| 2015 | 3.3 | 71.5 | 1020 | 9.8 | 9980.2 | 6.1 | 26.9 | 19 | 1.3 | ||||||||||
| 2016 | 7.3 | 162.5 | 1170 | 13.2 | 9861 | 21.8 | 28.9 | 19.5 | 1.8 | ||||||||||
| 2017 | 16.7 | 331.5 | 1360 | 19.6 | 10058.8 | 39.9 | 37.8 | 20 | 2.6 | ||||||||||
| 2018 | 31.7 | 609.5 | 1470 | 28.4 | 10291.8 | 79.9 | 45.7 | 20.5 | 3.6 | ||||||||||
| 2019 | 57.2 | 956.7 | 1610 | 38.7 | 10492.5 | 79.8 | 49.8 | 21 | 4.7 | ||||||||||
| 2020 | 94.3 | 1521.6 | 1750 | 46.3 | 10713.5 | 96.3 | 61.6 | 21.5 | 5.7 | ||||||||||
| 2021 | 127.9 | 2002.5 | 1900 | 53.9 | 10934.6 | 183.8 | 110.4 | 22 | 6.4 | ||||||||||
| 2022 | 164.5 | 2483.4 | 2000 | 61.5 | 11155.6 | 184.5 | 117.3 | 22.5 | 7.3 |
1 | import pandas as pd |
1 | import pandas as pd |
1 | import pandas as pd |
1 | import pandas as pd |
1 | import pandas as pd |